You might not see smoke, but every heavy script on your homepage burns energy in a distant data‑centre. Today you’ll learn how to measure your website’s carbon footprint in under an hour, translate the grams into business impact, and plot your first reduction steps.
Table of Contents
Spot the problem: how a slow site inflates your carbon impact
Modern sites average 2.65 MB per page, about 15 % heavier than in 2022, according to the 2024 HTTP Archive Sustainability report. Extra bytes slow load times and raise emissions. You also pay for that waste through higher hosting bills.
If those numbers ring true, check our guide to signs your site needs rebuilding next.
Core Web Vitals are only half the story
Largest Contentful Paint (LCP) and Total Blocking Time (TBT) flag user pain. They don’t show the hidden cost in grams of CO₂, and that’s where carbon tools step in.
Page weight → grams CO₂: the quick math
Most calculators multiply page size by grid‑intensity factors (kg CO₂e per kWh). The bigger the file, the higher the footprint. Simple.
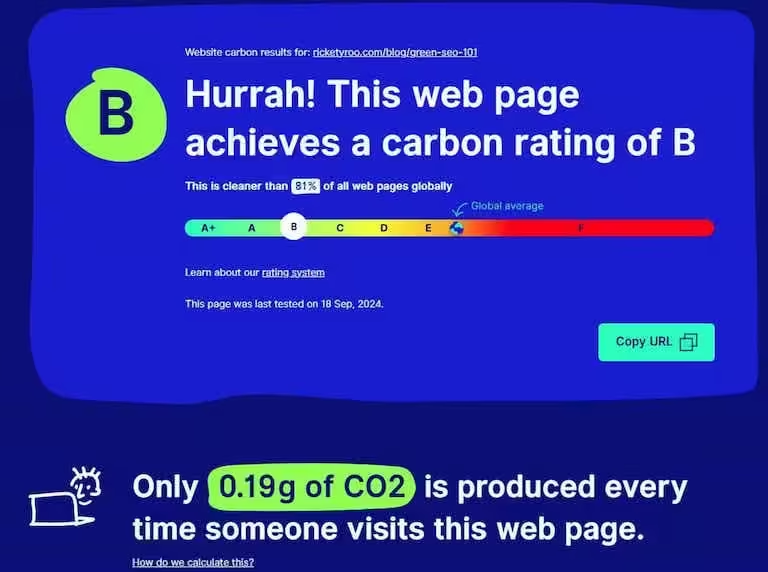
Run a speed & carbon test with Website Carbon Calculator
Paste any URL into Website Carbon Calculator from Wholegrain Digital. You get two numbers: grams CO₂ per page‑view and an estimated annual total based on traffic.
Use Google Lighthouse as a fast proxy
Open Google Lighthouse in Chrome DevTools. Look for Bytes downloaded. Divide by 1 MB ≈ 1.8 g CO₂ to get a ballpark figure. It’s quick, but less precise.
Cross‑check results with EcoPing & Blacklight
Run your page through EcoPing. It blends Lighthouse speed data with carbon calculations and tracks trends over time. Blacklight adds privacy scanning, showing how third‑party scripts bloat both size and emissions. Round off by testing with Digital Beacon and Ecograder to see how methodology affects the score.
Understand the numbers: carbon equals code weight
The Sustainable Web Design Model (SWDM) explains why: data transfer, energy intensity, and renewable offsets determine emissions.
Operational vs embodied emissions in plain English
- Operational: energy used while serving the page.
- Embodied: energy used to manufacture devices and build infrastructure.
Reducing operational load cuts both.
Measure a baseline across your key WordPress pages
Focus on templates that drive traffic and revenue, home, product, blog.
Bulk‑test templates in EcoPing
EcoPing’s batch mode tests up to 50 URLs and exports CSV. Log the results in a simple spreadsheet, columns like URL, kB, g CO₂, and test date.
Schedule regular checks, no code required
Set a monthly calendar reminder (or project‑management task) to re‑run EcoPing on your top URLs and jot the numbers in the same spreadsheet.
Compare results and set a carbon budget
Rank pages by grams‑per‑view and traffic
A carbon budgeting framework starts with a realistic target, about 0.3 g CO₂ per view for content-driven WordPress sites (or up to 0.4 g if you’re running WooCommerce or membership features), and sets a longer-term goal of 0.2–0.3 g once major optimisations are in place. Prioritise high‑traffic offenders first. Our lean plugin cheatsheet below will help.

Get Our Lean WordPress Plugin Cheat Sheet
Download our FREE guide to lightweight plugins that boost speed without bloating your site.
Turn reduced bytes into hosting‑cost savings
Every 1 GB you shave off monthly saves about 1.8 kg CO₂ and trims your CDN bill. The Green Web Foundation grid‑intensity map shows extra gains if you host on renewable‑powered servers.
Move from metrics to action: continuous monitoring & expert help
Optional: automated guards for dev teams
Using the co2.js GitHub Action, you can fail a build that pushes any page over budget, similar to linting rules for code style. Skip this step if you outsource development or prefer manual reviews.
When to book a full performance & sustainability audit
If page weight drops stall or you need deeper WordPress plugin/theme impact tracking, book a full website audit. We combine speed, UX, and carbon insights into one roadmap.
Curious How Fast and Green Your Site Is?
We analyse your website's carbon footprint, page weight and performance. See what's slowing it down and how to clean it up.
Carbon Impact FAQ
What is a good carbon footprint for a web page?
Start by aiming for under 0.3 g CO₂ per page-view for content sites (under 0.4 g for e-commerce or membership builds). After optimisation, aim for 0.2–0.3 g.
Do carbon calculators slow my site?
No. They run off‑site using a copy of your page. There’s zero impact on users.
Can I reduce emissions without a rebuild?
Yes. Compress images, remove unused plugins, serve static assets from a CDN, and lazy‑load media. A rebuild brings deeper gains but isn’t always required.
How often should I measure my website’s carbon footprint?
Check after any major release or at least once a quarter. Automating with co2.js ensures you never miss a spike.
Conclusion
You now have the tools to spot waste, measure it, and budget for lower emissions. Act on the numbers today and enjoy a faster, greener, and cheaper site tomorrow.