
It’s easy to imagine the internet as clean and weightless. After all, it’s “just data,” floating somewhere in the cloud. But the truth is heavier. Every email, video, and AI query is powered by vast data centres, long-haul networks, and billions of devices, all pulling from power grids that are still mostly fossil-fuelled.
Table of Contents
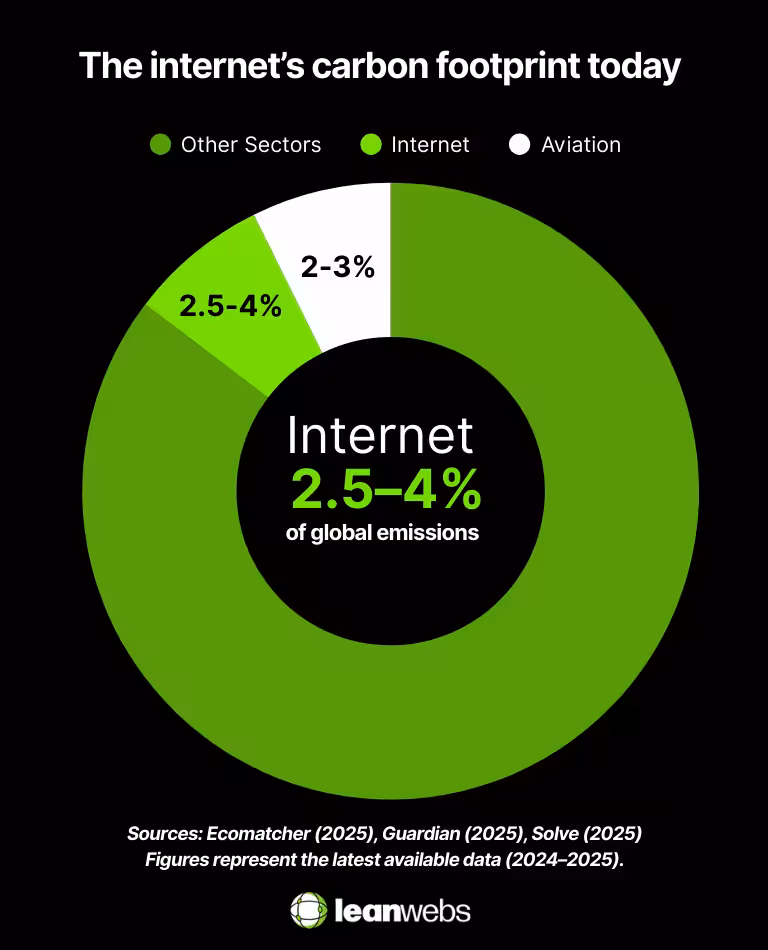
By 2025, the internet’s carbon footprint is too big to ignore. Studies put its share of global greenhouse gas emissions between 2.5% and 4% – roughly equal to, and in some estimates larger than, the entire aviation industry (Ecomatcher, 2025; Guardian, 2025). In other words: the web is now one of the biggest industries on Earth by carbon impact.
This guide breaks down what that means today, where the emissions come from, and the trends pushing the numbers higher. We’ll keep the focus practical, connecting global stats back to what they mean for your website, and the steps you can take to cut weight, cut carbon, and keep things lean.
The internet’s global carbon footprint today
If you’ve ever thought “how can the web pollute – it’s all invisible,” you’re not alone. But invisibility doesn’t mean impact-free. Data centres and networks run on real electricity. Devices need rare minerals and manufacturing. And together, they add up fast.
- Researchers estimate that the internet and digital technologies now account for 1.5% to 4% of global greenhouse gas emissions (Ecomatcher, 2025).
- A widely used benchmark is around 3.7%, roughly the same as all global air travel (Solve, 2025).
- A Columbia Climate School analysis tightened the range to 2.5%–3.7%, confirming that the digital sector has already outpaced aviation (Guardian, 2025).
Here’s how the internet compares to aviation and other major emitters at a glance:
Think of it this way: if the internet were a country, it would sit among the world’s top five emitters. And unlike aviation, which grows steadily, digital demand climbs every year – streaming, cloud, AI, new devices – which means its footprint is only heading one way.
Curious how this translates to your own corner of the web? Our guide on calculating your website’s carbon impact walks you through it page by page.
Where the emissions come from
The internet’s footprint isn’t one big smokestack somewhere. It’s spread across three layers: data centres, the networks that connect them, and the billions of devices in our hands. Each one adds its own weight, and together they explain why the “invisible” web has such a visible impact on the planet.
Data centres and networks: the engine room
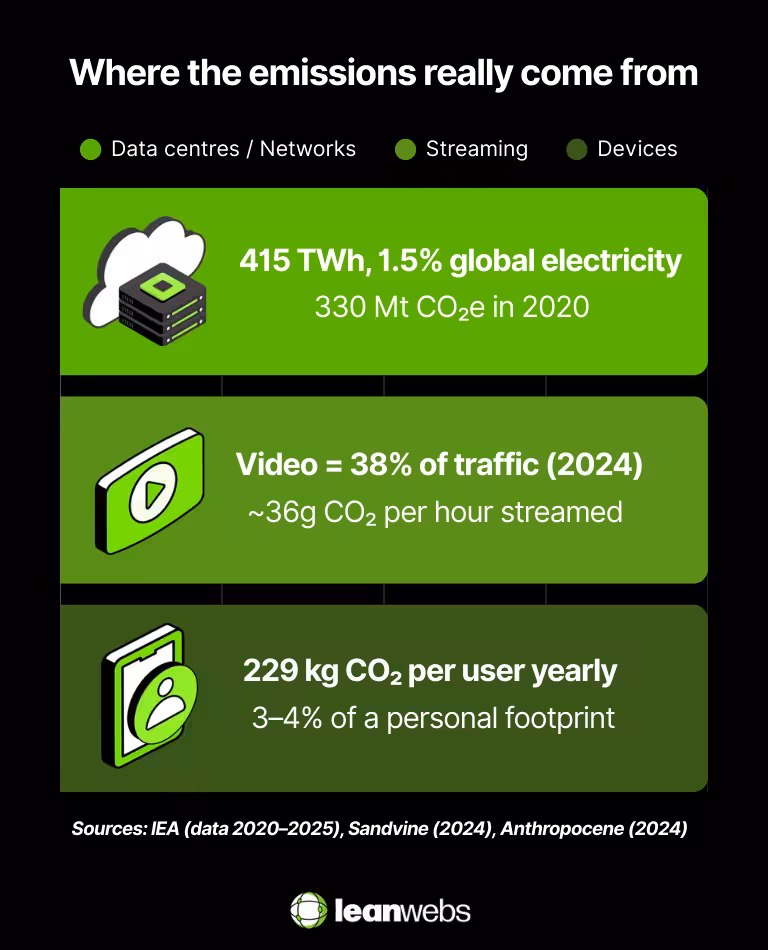
Behind every click is a server humming in a warehouse. These facilities are the web’s engine room: noisy, hot, and hungry. They need electricity to run racks of machines and almost as much again to keep them cool. By 2024, data centres were using about 415 TWh of electricity – around 1.5% of global demand, with networks adding another big slice (IEA, 2025). Together, they were already responsible for ~330 Mt CO₂e as far back as 2020 (IEA, 2020). And the load is only getting heavier as AI and cloud workloads surge.
Streaming: the web’s guilty pleasure
Streaming is the heavyweight of internet demand. Sandvine’s 2024 report shows video now makes up 38% of all downstream traffic (Sandvine, 2024). On its own, an hour of streaming might look modest, roughly 36 g CO₂ – but multiply that by billions of hours watched every day, and the impact snowballs (IEE, 2019).
Devices: the hidden heavyweight
The surprise for many people? The biggest share of emissions often isn’t in the cloud at all, it’s in your pocket or on your desk. Manufacturing smartphones, laptops, and TVs involves mining, chip production, and shipping – processes that front-load their carbon cost before you’ve even switched them on. Average online activity adds up to 229 kg CO₂ per user each year, equal to 3–4% of a personal footprint (Anthropocene, 2024). That’s like running a fridge nonstop just for your browsing.
Put together, these three layers explain where most of the internet’s footprint comes from:
Quick snapshot
- Data centres & networks: ~330 Mt CO₂e (2020); data centres alone = 415 TWh, 1.5% of global electricity (2024)
- Streaming: 38% of downstream internet traffic (2024); ~36 g CO₂ per hour streamed
- Devices: 229 kg CO₂ per user/year (2024); 3–4% of a personal footprint
Want to trim your own site’s share? Start with what users actually load. Our Toolkit guide on how to lazy load images in WordPress shows you how to cut weight without cutting quality.
Trends & drivers shaping 2025
The internet isn’t static. The forces shaping its footprint in 2025 are bigger than any single website, but understanding them shows where the pressure is coming from, and why action at every level matters.
AI: the new heavyweight
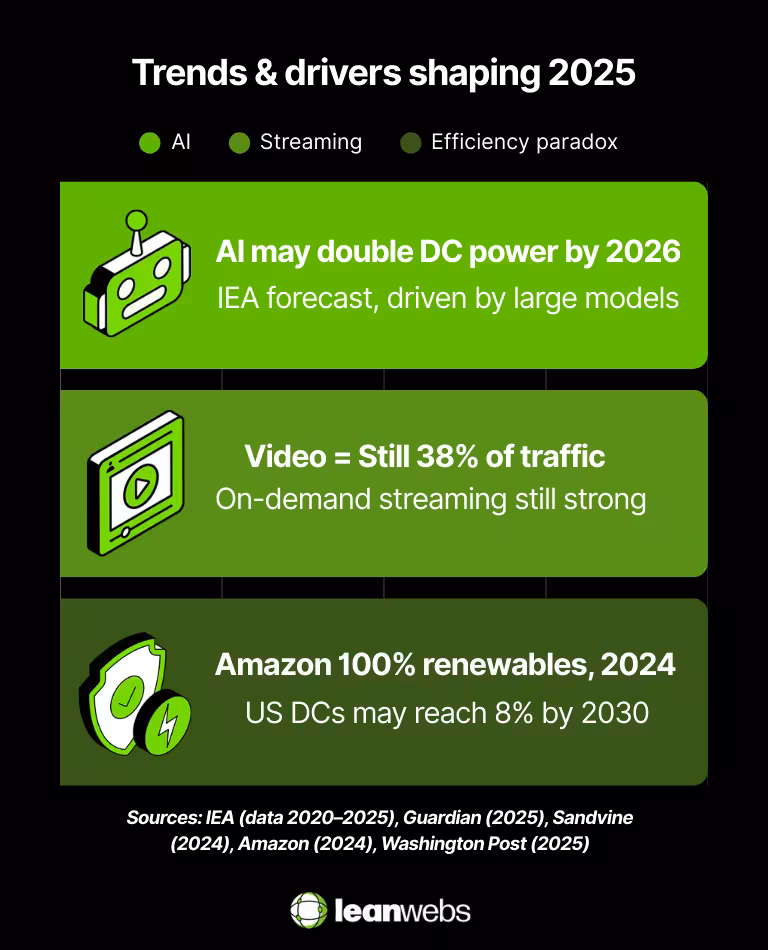
AI has shifted from niche to mainstream almost overnight. Every query you run against a large model needs far more compute, and therefore energy, than a standard search. The International Energy Agency warns that data centre electricity demand could double by 2026, with AI the main driver (IEA, 2023). Google’s own figures show its emissions have risen 51% since 2019, largely due to AI workloads and expanding data centres (Guardian, 2025).
Streaming & social video: still climbing
Video hasn’t slowed down. From Netflix marathons to TikTok scrolls, video continues to eat bandwidth. In 2024, it made up 38% of downstream traffic, with on-demand streaming the biggest slice (Sandvine, 2024). Even as compression tech improves, higher resolutions (4K, 8K) and autoplay keep driving demand.
Efficiency paradox: gains vs growth
Here’s the frustrating part: we’re getting better at efficiency, but growth is outpacing the wins. Data centres are achieving lower Power Usage Effectiveness (PUE) and big players like Amazon report 100% renewable energy matching for 2024 (Amazon, 2024). But when workloads explode, whether it’s AI or streaming – total emissions still rise. The Washington Post warns data centres could use up to 8% of US electricity by 2030, even with efficiency gains (Washington Post, 2025).
These trends show why the footprint is growing faster than efficiency gains can keep up:
Quick snapshot
- AI: Data centre electricity demand may double by 2026; Google emissions up 51% since 2019.
- Streaming: 38% of downstream traffic (2024).
- Efficiency paradox: Amazon reports 100% renewable energy matching (2024); US data centres could hit 8% of electricity use by 2030.
If your site leans heavily on video, that’s where you can act right now. Our guide on how to optimise video delivery in WordPress without plugins shows how to cut bandwidth without cutting reach
Infrastructure strain & environmental risks
The internet’s footprint isn’t just about carbon. The physical strain of powering, cooling, and expanding digital infrastructure creates new challenges for grids, water systems, and even waste streams. These pressures are often invisible to end users, but they’re critical to the sustainability story.
Power grids under pressure
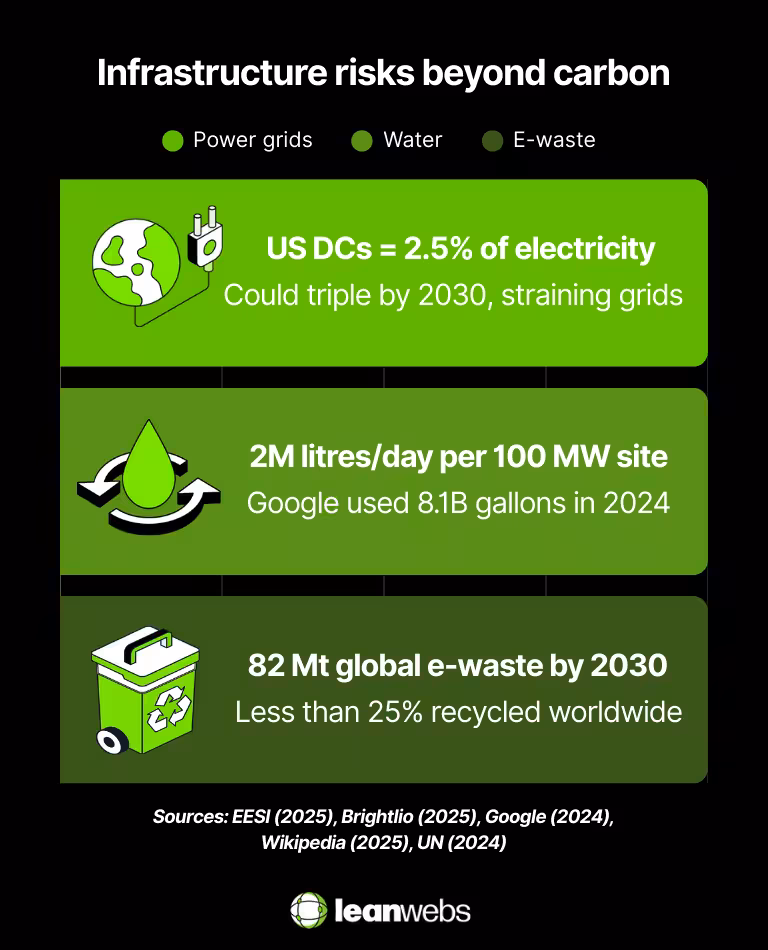
Data centres don’t sip power, they gulp it. A single large facility can draw 100 MW or more, the same as a small city. In the US, data centres already account for 2.5% of total electricity consumption, and analysts project that share could triple by 2030 (EESI, 2025; Brightlio, 2025). That scale of growth creates tension with local grids, and can stall renewable transitions if fossil plants are kept online to meet surging demand.
Water use: the hidden cost of cooling
Keeping servers cool takes more than air conditioning – it takes water. A 100 MW data centre may use 2 million litres per day, and globally data centres already consume 560 billion litres of water annually, with usage expected to double by 2030 (Wikipedia, 2025). Google reported using 8.1 billion gallons in 2023 across its operations, replenishing about 64% back into local watersheds (Google, 2024). AI workloads add to the pressure, raising demand for both cooling water and chip production.
E-waste and embodied impact
The servers and devices that power the internet don’t last forever. As AI accelerates hardware refresh cycles, the embodied footprint grows. By 2030, AI-driven demand could add 1.2 to 5 million metric tons of e-waste worldwide (Wikipedia, 2025). Globally, e-waste already reached 62 million tons in 2022 and is on track to hit 82 million by 2030, with less than 25% properly recycled (UN, 2024).
Beyond carbon, digital infrastructure creates knock-on pressures you can see here:
Quick snapshot
- Grids: US data centres = 2.5% of electricity use, could triple by 2030.
- Water: 2M litres/day per 100 MW site; global = 560B litres annually, doubling by 2030; Google used 8.1B gallons in 2024.
- E-waste: AI may add 1.2–5 Mt by 2030; global total 82 Mt by 2030, only 22–25% recycled.
Want to design lighter pages that reduce both energy and cooling load downstream? Our Learn guide on what is sustainable web design and why it matters explains the principles that connect efficiency and sustainability.
Why it matters for you – and what you can do
It’s one thing to read about terawatt-hours and megatons. But what do these global numbers mean for your site, your business, or your projects? The good news: while you can’t stop the growth of AI data centres, you can control the footprint of your own corner of the web.
For small businesses and creators
If you run a shop, portfolio, or content site, your pages are part of the chain. Every extra script or oversized image makes visitors’ devices and networks work harder. For a typical website, the average page view produces around 0.36 g CO₂ (Website Carbon, 2025). That might not sound like much, but at 100,000 visits per month, it adds up to 43 kg CO₂ – the same as driving a petrol car for 175 km.
For developers and agencies
Your code choices ripple out at scale. Bloated themes, unoptimised plugins, and third-party scripts inflate every page load. By deferring JavaScript, compressing images, and reducing payloads, you not only cut carbon but also deliver faster experiences that keep clients’ users engaged. These are the very tactics we cover in our Toolkit, like how to defer parsing of JavaScript in WordPress.
For anyone online
Even as a regular user, your habits matter. An individual racks up about 229 kg CO₂ each year from online activity (Anthropocene, 2024). That’s 3-4% of a personal footprint – enough to notice. Choosing lower-resolution streaming, holding onto devices longer, and picking cloud services that run on renewables all tilt the balance.
Here’s how the global picture scales down to a single site, a single page, and even a single user:
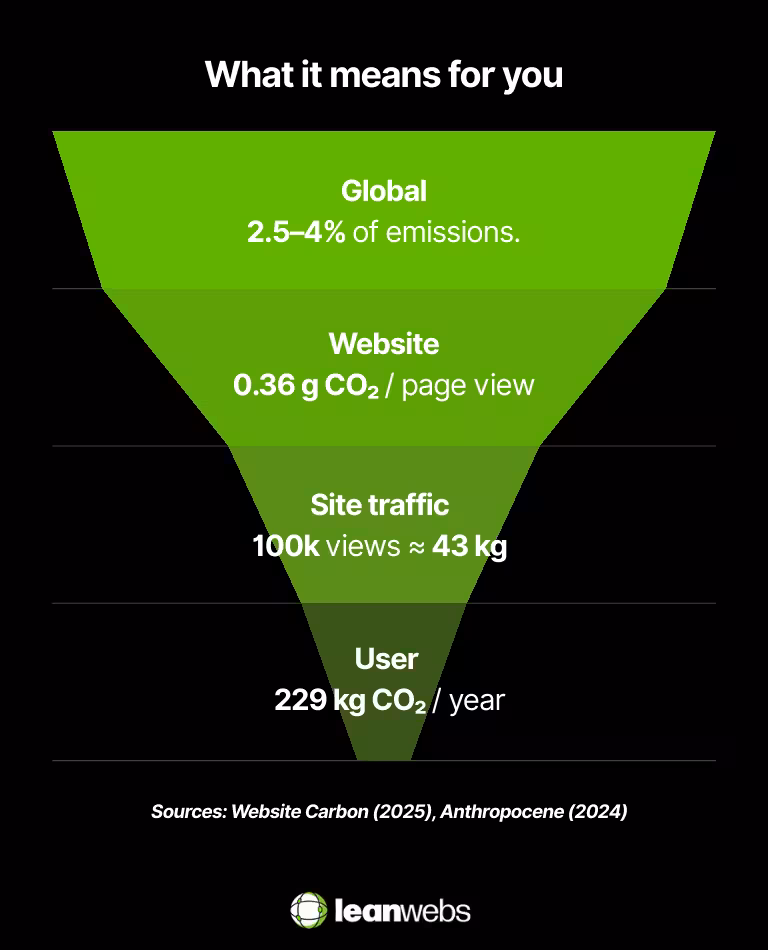
Quick snapshot
- Websites: Average page = 0.36 g CO₂ per view (Website Carbon, 2025).
- Small sites at scale: 100,000 monthly views ≈ 43 kg CO₂, equal to 175 km driven.
- Developers: Leaner code = faster sites + lower carbon.
- Users: Average footprint = 229 kg CO₂/year, about 3–4% of total emissions.
Ready to see where you stand? Start with our Learn guide on how to calculate your website’s carbon impact, then pick one Toolkit fix to put into practice this week.
The Quick Fix for a Slow, Heavy Site
We optimise your site for speed, efficiency and sustainability. No rebuild. No delays. Just better performance and a lighter footprint.
The big picture – and your part in it
The numbers are big, but the message is simple: the internet’s carbon footprint is real, growing, and shaped by choices at every level, from hyperscale data centres to the weight of a single page on your site.
- Globally, the web accounts for 2.5–4% of greenhouse gas emissions, rivaling aviation.
- The load is driven by AI workloads, streaming, and billions of devices, with data centres already consuming 1.5% of global electricity.
- Beyond carbon, data centres strain grids, water systems, and material supply chains, adding layers to the sustainability challenge.
- And at the individual level, the average internet user generates 229 kg CO₂ per year just from being online.
That may sound daunting, but here’s the upside: every optimisation, every lighter image, every leaner line of code adds up. You can’t change the trajectory of AI data centres tomorrow, but you can cut your site’s load today, and that makes the whole network a little greener, a little faster, and a lot more sustainable.
Next steps:
- Start with our Learn article on what is sustainable web design and why it matters.
- Measure your own site’s footprint with how to calculate your website’s carbon impact.
- Put one fix into action – try our Toolkit guides on optimising video delivery or lazy loading images.
Small steps compound. The web doesn’t have to be wasteful, and the sooner we trim the bloat, the better for performance, users, and the planet.
Figures represent the latest available data (2024–2025).