Not sure whether to keep patching your site or start from scratch? This guide walks you through quick, low‑tech checks that show when a rebuild is the smarter, greener, and more profitable move.
Table of Contents
TL;DR
Rebuild if three or more apply: page loads exceed 3 s, active plugins > 25, CO₂ per page > 1 g, security patches overdue, or bounce rate up 15 % year‑on‑year.
How to Spot Red Flags That Signal a Website Rebuild
Users abandon on mobile – here’s why
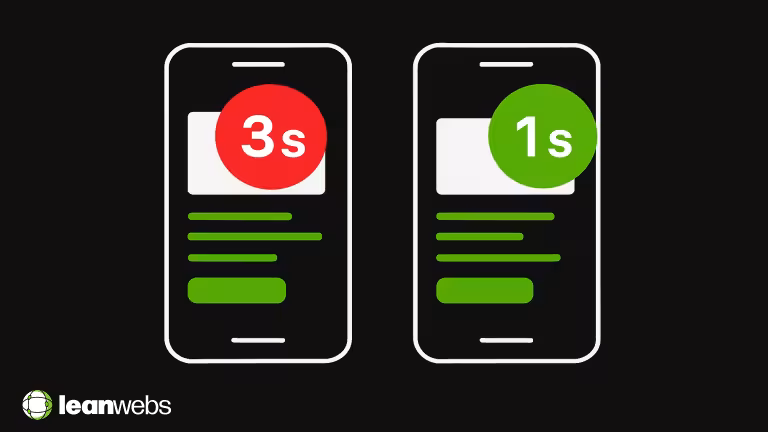
Think about the last time you visited a page that took forever to appear. Mobile users feel that pain first. If your Largest Contentful Paint (LCP), the time it takes for the main image or headline to show, regularly tops three seconds on 4G, half of your visitors will leave before they even see your offer. Check your own site by opening it on your phone with Wi‑Fi turned off. Does the hero image lag? Do buttons jump around as ads or cookie banners load? That jumpy behaviour is Cumulative Layout Shift (CLS), and it frustrates shoppers faster than a slow cashier.
Bounce rate climbs while conversions dip
Open Google Analytics. Compare the last six months of bounce‑rate and conversion data. If bounce climbs from, say, 45 % to 60 % while sales drop 10 %, your pages feel broken to visitors. One silent culprit is Time to First Byte (TTFB), the server warm‑up before any content arrives. Anything over 200 ms hints at dated hosting or heavy plugins. Free testers such as GTmetrix reveal your TTFB in a single click.
Brand visuals feel five years old overnight
Design trends shift every 18 months. Rounded corners, oversized type, muted colour palettes, each change quietly nudges consumer trust. If your site still uses glossy gradients from 2019, you shout “behind the times”. A rebuild lets you refresh brand visuals while fixing the under‑the‑hood speed issues in the same project.
Need a quick health snapshot? Our how a website audit can help guide shows exactly where your pages slow, or pollute the web.
Validate Your Hunch with Core Web Vitals and a 2‑Minute Google Check
Pull real‑world data from Search Console
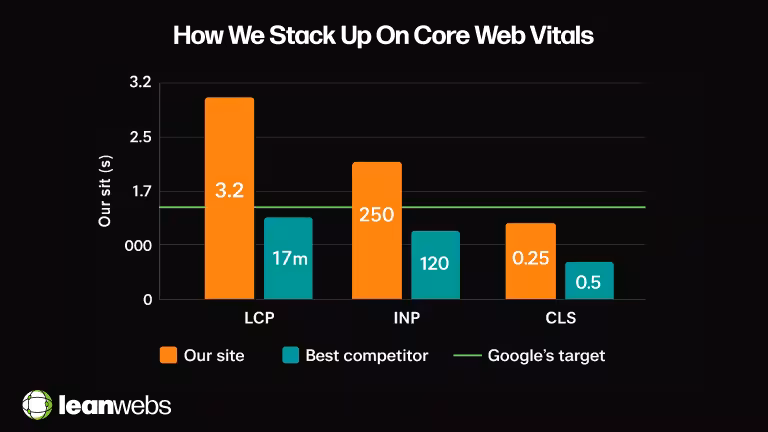
Log in to Google Search Console and open the Core Web Vitals report. It grades your URLs green, amber, or red. Red pages drag your whole site in Google’s eyes, especially after the 2025 ranking update that put Interaction to Next Paint (INP) front and centre. Screenshot any red bars. They make a powerful slide when you need budget approval.
Benchmark rivals’ pages in seconds
Copy a competitor’s homepage URL. Paste it into PageSpeed Insights. Google scores their site on the same Core Web Vitals. If they sit in the green while you sit in amber, the market is literally outrunning you. Repeat with two more rivals so you know whether the issue is industry‑wide or only you.
Tie findings back to real people
Data feels abstract until it meets a story. Picture three visitor groups:
- Parents on phones skimming for prices between school runs.
- Busy executives checking your credentials on a laptop before a meeting.
- Late‑night researchers on tablets reading reviews.
Match each group to your worst performers. If the “Parents” landing page loads in five seconds, that’s not just a speed number, it’s lost family budgets choosing a faster rival.
Benchmark Your Site – Data, Not Drama
Measure page‑level carbon footprint (grams of CO₂)
Drop five high‑traffic URLs into Website Carbon. Scores under 0.3 g per view are world‑class; over 1 g means every visit burns unnecessary power. Multiply 1 g by 100 k monthly views and you’re emitting 100 kg CO₂, the weight of an adult each month.
Run a quick accessibility scan
Tools like WAVE or Axe flag low‑contrast text and missing labels. Fixing them helps everyone and lowers bounce.
Check for security warnings
Pop your domain into SSL Labs for a quick grade. If it says you’re still on PHP 7, patches ended in November 2022, time is ticking.
Watch your conversion funnel
Inside analytics, trace Home → Product → Cart → Checkout. A 70 % exit at Cart hints at speed or trust issues. Pair that stat with your speed tests to pinpoint friction.
Want firm numbers? Follow the walkthrough in our measure your website’s carbon footprint guide to capture before‑and‑after CO₂.
Weigh Quick Fixes Against Full Rebuild Costs
Audit plugin bloat & hidden extras
Log into WordPress and count active plugins. Over 25 usually means overlap, two SEO tools, three form plugins, a page builder, and a dozen forgotten experiments. Each loads its own CSS and JavaScript, slowing every page. A rebuild removes the cruft and gives you lean, purpose‑built functions. Download our free lean plugin cheat sheet below which will help keep page weight down.
Get Our Lean WordPress Plugin Cheat Sheet
Download our FREE guide to lightweight plugins that boost speed without bloating your site.
Count the cost of technical debt
Technical debt is like interest on a loan: skip a fix today, pay double tomorrow. Tally weekly developer hours spent on hot‑fixes. Multiply by your hourly rate. Spend £400 a month patching bugs? That’s £4,800 a year. Three years of that funds a £14 k rebuild, leaving you with clean code instead of more duct tape.
Compare three years of patches with one rebuild
| Decision Factor | Patch & Optimise | Full Rebuild |
|---|---|---|
| Up‑front cost | £ (low) | £££ (moderate) |
| Speed improvement | Incremental (5–15 %) | Significant (40–80 %) |
| Carbon reduction | Small (10–20 %) | Large (50–80 %) |
| Maintenance hours | Continuous | Minimal |
| Compliance risk | Needs constant audits | Built‑in WCAG & GDPR |
| Break‑even timeline | 3+ years (if ever) | 12–18 months |
Factor in legal risk
GDPR fines start at €10 k for missing cookie consent; U.S. ADA fines start at $75 k. If your pop‑ups block screen readers or personal data travels over outdated TLS, real money is on the line. A rebuild bakes compliance in once, rather than bolting it on each audit.
Calculate Sustainability & Long‑Term Wins
Model carbon savings after a rebuild
Shrink a 2 MB homepage to 600 kB and you cut ~70 % bandwidth. The Green Web Foundation estimates that saves around 35 kg CO₂ monthly, the carbon of a 290 km petrol drive.
Choose greener hosting
Since 2023, the biggest speed gains come from servers running on renewables and HTTP/3. Moving from shared hosting to a managed, green VPS often halves TTFB.
Accessibility = better business
The Click‑Away Pound report found UK retailers lose £17 bn a year because disabled shoppers drop off sites they can’t use. Hitting WCAG AA welcomes 15 % more shoppers by default.
Fewer emergency fixes
Modern frameworks auto‑update safely, ending 2 a.m. “site hacked” calls and weekend emergency rates.
Short‑List Rebuild Approaches That Fit Your Skills
Modern WordPress block theme
Block themes use the same drag‑and‑drop editor you know, only site‑wide. They dump bulky page‑builder code, saving up to 200 kB per page.
Headless or decoupled build
Content stays in WordPress; visitors get near‑instant pages rendered by Next.js or Astro. Need developer help for tweaks, but speed can jump 80 %.
Set clear speed targets
Aim for: LCP < 1.8 s, INP < 150 ms, CLS < 0.1. These numbers earn the coveted “Fast Page” badge in Chrome.
Future‑proof now
Adopt next‑gen formats (AVIF, WebP 2) and CSS Container Queries to sidestep layout hacks. Rebuild once; stay modern for years.
Win Stakeholder Buy‑In with a Simple Scorecard
Show before‑and‑after data
One eco‑shop rebuilt their 4.5 MB homepage to 500 kB. Page views rose 30 %, add‑to‑cart rate doubled, and electricity use on hosting dropped 80 %, proof that speed sells.
Compare budget vs. lost revenue
Visualise £5 k annual patch spend versus a £15 k one‑time rebuild. If sales gains close the gap by month 18, finance signs off.
Set success metrics
Create a traffic‑light dashboard: green when LCP < 2 s, CO₂ per page < 0.3 g, monthly sales > baseline. Amber triggers review; red sparks an optimisation sprint.
Make the Call and Book Your Next Check‑Up
Decide with a score
Rate speed, carbon, cost, and risk from 1 (low) to 5 (high). An average of 3 or more means rebuild beats patch.
Map costs and savings for three years
Sketch monthly patch spend versus a one‑time rebuild. Most SMEs break even half‑way through year 2.
Track carbon every quarter
Add CO₂ per page to your KPI sheet. Watching it fall doubles as ESG marketing.
Automate speed alerts
Free tools like Better Stack or DebugBear email you if LCP slips past target.
Keep your foundations solid with our evergreen sustainable web‑design guide.
Website Rebuild FAQ
Is a redesign enough, or do I need a rebuild?
A redesign tweaks the look and feel. A rebuild replaces outdated code, slashes load times, and meets 2025 Core Web Vitals. If your site is both slow and hard to update, opt for a rebuild.
How long does a rebuild take?
Most business sites finish in 8–14 weeks, including fresh copy and images.
Will a fancy new build hurt my SEO?
No. Google rewards faster, more accessible sites. Expect an uptick after the first crawl.
How do I measure carbon savings afterward?
Run Website Carbon before and 30 days after launch. Subtract the new grams‑per‑view score from the old one, convert to kilograms, and multiply by your monthly pageviews to see the monthly CO₂ saved.
What’s the three‑year cost of ownership?
Add greener hosting, slim plugin fees, and 1–2 maintenance hours monthly. Most rebuild projects pay for themselves within 18 months.
Conclusion
Patching feels cheaper, but over three years it rarely is. Run the checks, fill the scorecard, and if the numbers shout “rebuild,” act. You’ll earn faster pages, greener hosting, and happier visitors, today and in every Google update to come.
Ready for a Low‑Carbon Rebuild?
Book a free 30‑minute consult with our Green Development Service, we’ll map out exactly how much speed, carbon, and cash you can save. Schedule your chat and start building the faster, cleaner site your visitors deserve.